 Topics
Public Opinion on Artificial Intelligence Varies Widely by Age, Gender, Race, and Frequency of Use
Over the past several years, artificial intelligence (AI) technology has become a fixture of everyday life for millions of Americans, from engaging with chatbots to viewing AI-generated content online. Technology companies have invested hundreds of billions of dollars in AI, and it drove up to 80% of U.S. stock gains in 2025, according to one estimate. Meanwhile, lawmakers in Washington remain divided over whether and how to regulate the technology.
In a new survey, Data for Progress asked voters how frequently they use AI in their daily lives, whether they have a favorable or unfavorable view of the technology, and how confident they are in their ability to spot AI-generated content when they encounter it online. The survey finds wide disparities in perceptions of and openness to AI across partisanship, gender, age, race, and frequency of AI use.
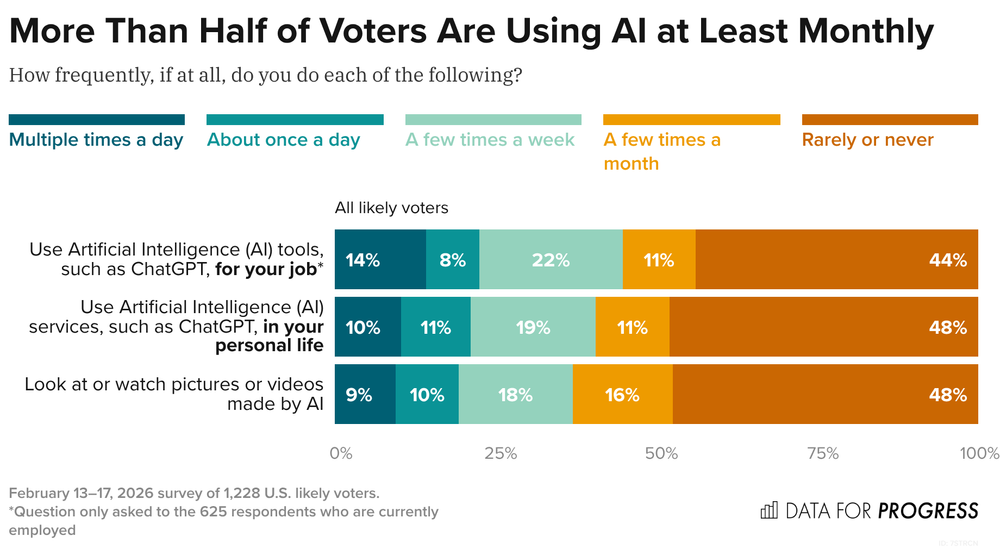
According to the survey, a majority of voters are using AI at least a few times a month for their job (55% among employed voters) and in their personal life (51%). More than 1 in 5 voters use AI at least once a day for their job (22%) and in their personal life (21%).
Tracking data over time shows a growing divergence in AI usage at work depending on educational attainment. Notably, among employed respondents, there has been a sharp rise in the percentage of college-educated voters who are using AI at least once a day for their job — from 22% in August 2025 to 34% today — while non-college-educated voters report a 6-point decrease in the same time frame.
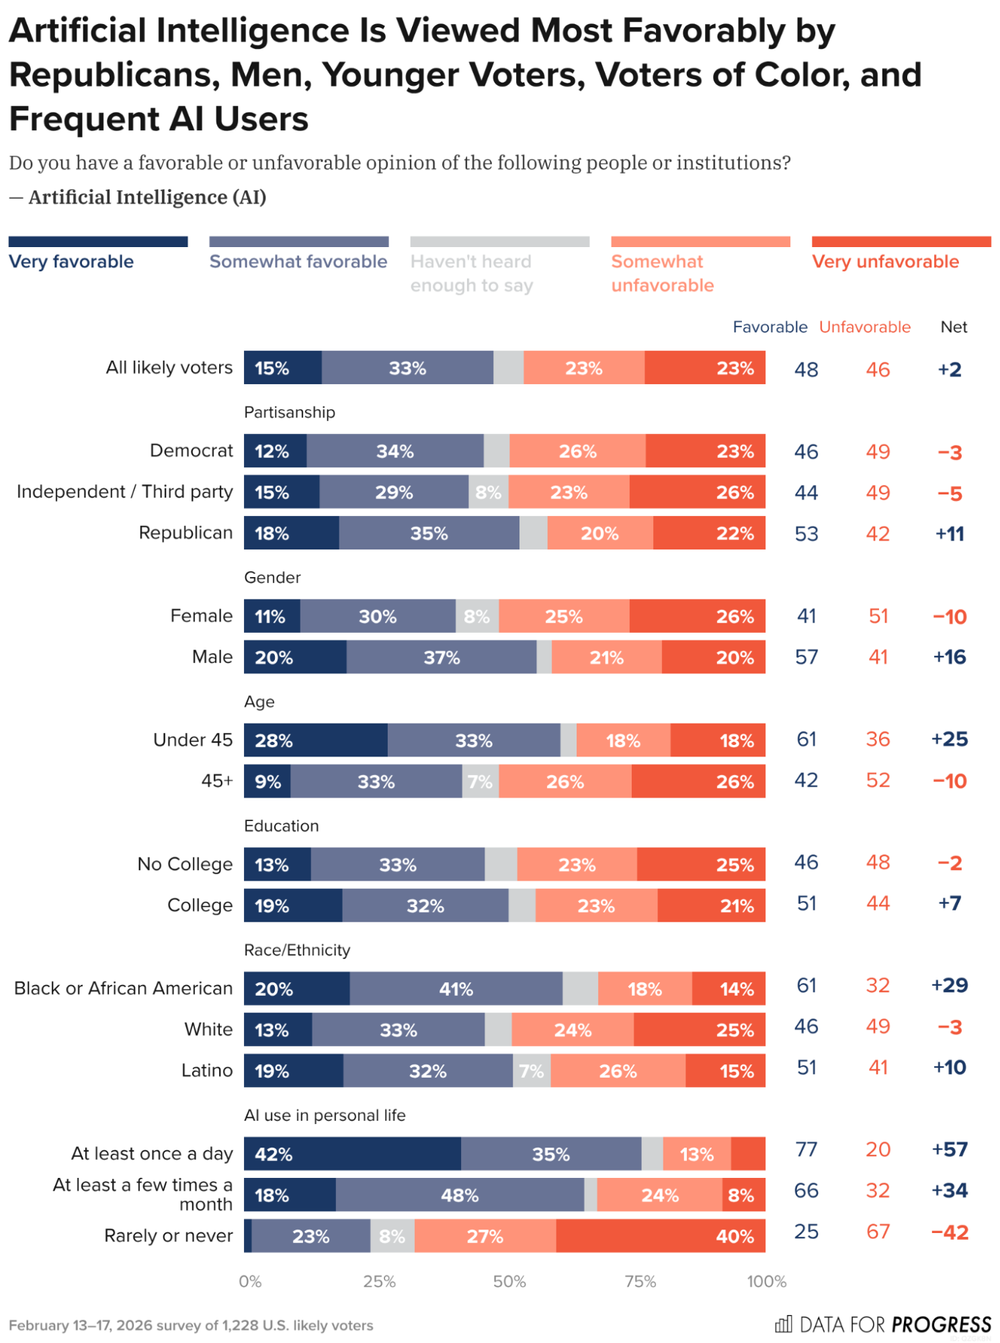
Opinions of AI are closely divided, with 48% of voters viewing the technology favorably and 46% unfavorably.
While a plurality of Democrats (-3) and Independents (-5) are unfavorable of AI, a majority of Republicans hold a favorable view (+11).
Other interesting disparities emerge across demographic lines. Women view AI unfavorably by a -10-point margin, while men view it favorably by +16 points. While most voters 45 or older are unfavorable of AI (-10), a majority of younger voters hold a favorable view (+25). Additionally, white voters are narrowly unfavorable of AI (-3), while Black (+29) and Latino (+10) voters are favorable of the technology.
However, the strongest predictor of voters’ attitudes toward AI is their personal usage of the technology. While voters who “rarely or never” use AI are unfavorable of it by a -42-point margin, those who use it at least once a day are favorable by an overwhelming +57-point margin.
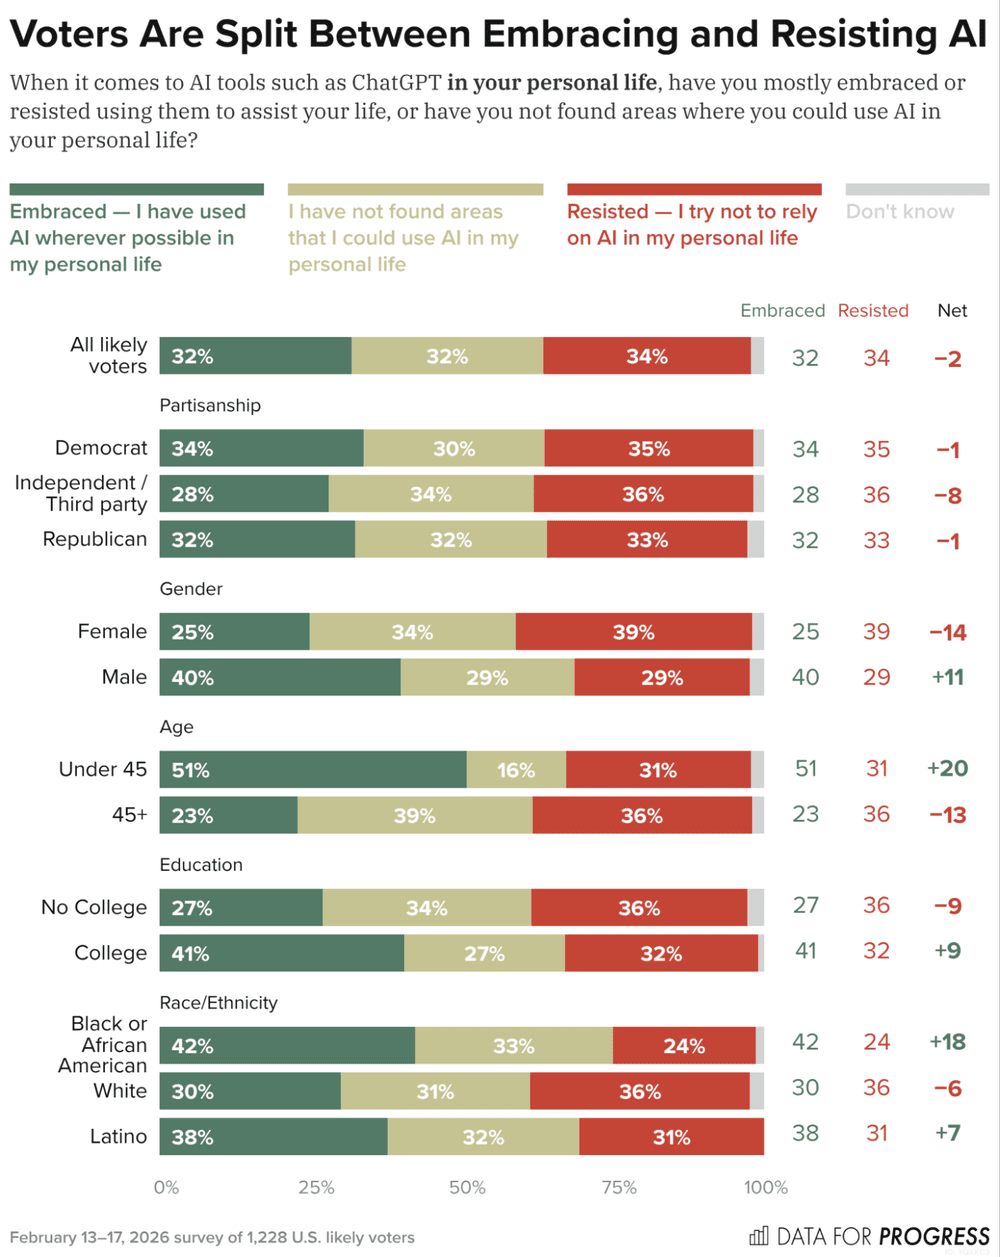
When asked whether they have embraced or resisted AI in their personal life, voters are split (32% vs. 34%, respectively), with an additional 32% saying they have not found areas to use AI in their personal life.
Again, men, younger voters, and voters of color — who also report higher levels of personal AI use — indicate greater openness to AI, although results do not vary significantly by partisanship.
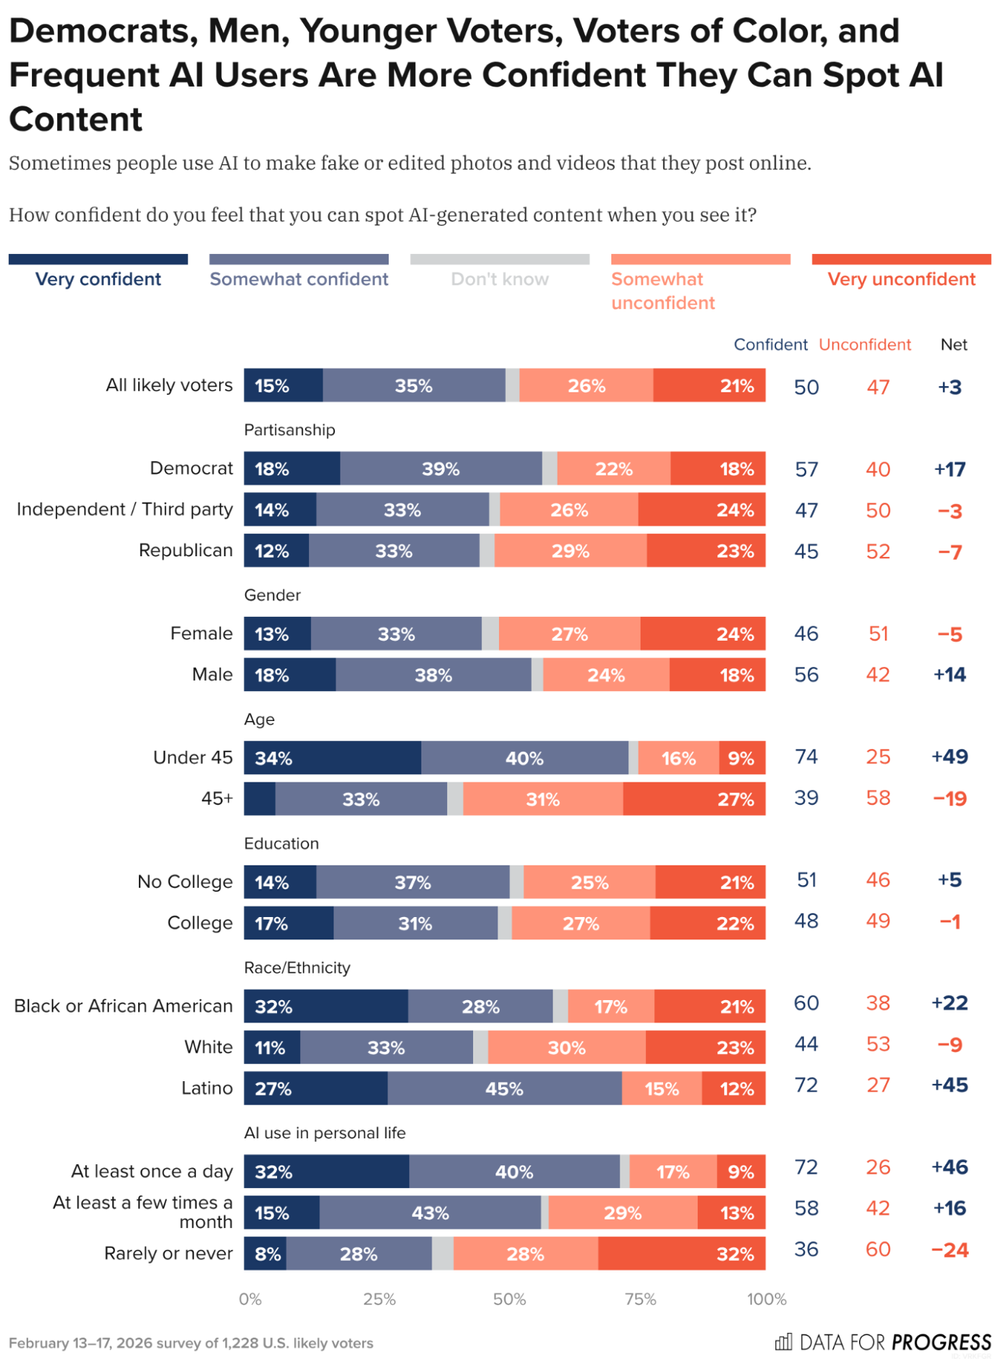
When asked how confident they are in their ability to spot AI-generated content, voters indicate middling levels of confidence. Only 15% of voters report being “very confident,” while 21% say they are “very unconfident.” The most common response from voters is that they are “somewhat confident” (35%) in their ability to spot AI content.
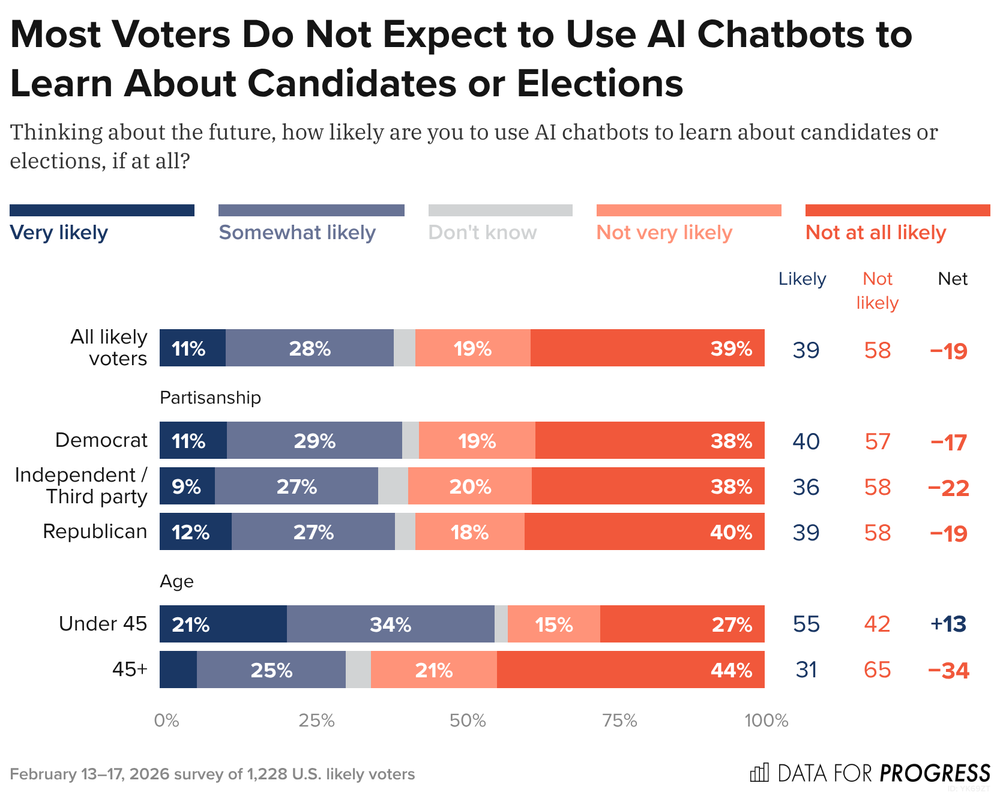
Respondents were also asked whether they expect to use AI chatbots to learn about candidates or elections in the future. A majority of voters (58%) — including majorities across partisan lines — say they are not likely to do this. However, a majority of voters under the age of 45 report that they are likely to use AI chatbots to learn about candidates or elections (55%).
Broadly, these findings indicate that voters have mixed views on AI. Voters are about evenly split between being favorable and unfavorable of AI in general, and between embracing and resisting the technology in their personal life. Additionally, there are significant disparities in openness to AI across demographic lines, with Republicans, men, younger voters, voters of color, and frequent AI users indicating more favorable views of the technology.
Survey Methodology
From February 13 to 17, 2026, Data for Progress conducted a survey of 1,228 U.S. likely voters nationally using web panel respondents. The sample was weighted to be representative of likely voters by age, gender, education, race, geography, and recalled presidential vote. The survey was conducted in English. The margin of error associated with the sample size is ±3 percentage points. Results for subgroups of the sample are subject to increased margins of error. Partisanship reflected in tabulations is based on self-identified party affiliation, not partisan registration. For more information please visit dataforprogress.org/our-methodology.
Source link www.dataforprogress.org